 |
 |

If your child needs math practice, click here.
For sample problems, click here.
Here are some tips for Bar Graphs, which aligns with Florida state standards:
Bar Graphs
A bar graph is one way to organize data.
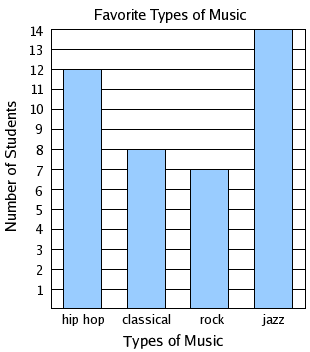
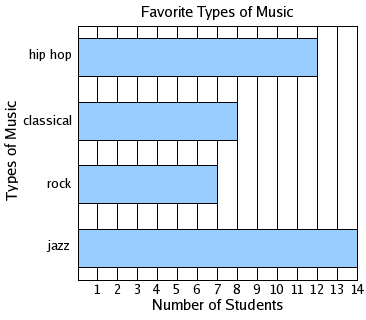
The bars represent the data - the longer the bar, the larger the value of the data.
|
|
|||
| The bars in a vertical bar graph go up. | The bars in a horizontal bar graph go across. |
Pay attention to the scale of bar graphs.
The scale tells you the value of the length of the bars.
Example: Same graphs, different scales
This graph shows that
12 students like hip hop,
8 students like classical,
7 students like rock,
and 14 students like jazz.This graph shows that
60 students like hip hop,
40 studnets like classical,
35 students like rock,
and 70 students like jazz.
Copyright Accurate Learning Systems Corporation 2008.
MathScore is a registered trademark.